Diagram Exhibition App
It is often difficult for learners to work with 3D diagrams — not surprising, since they are usually shown in two dimensions, on flat screens or paper. The Diagram Exhibition app for Meta Quest changes this by providing a true three-dimensional experience where users can walk around and explore data from every angle.
The app creates an immersive and interactive learning environment for self-study, classrooms, and online courses.
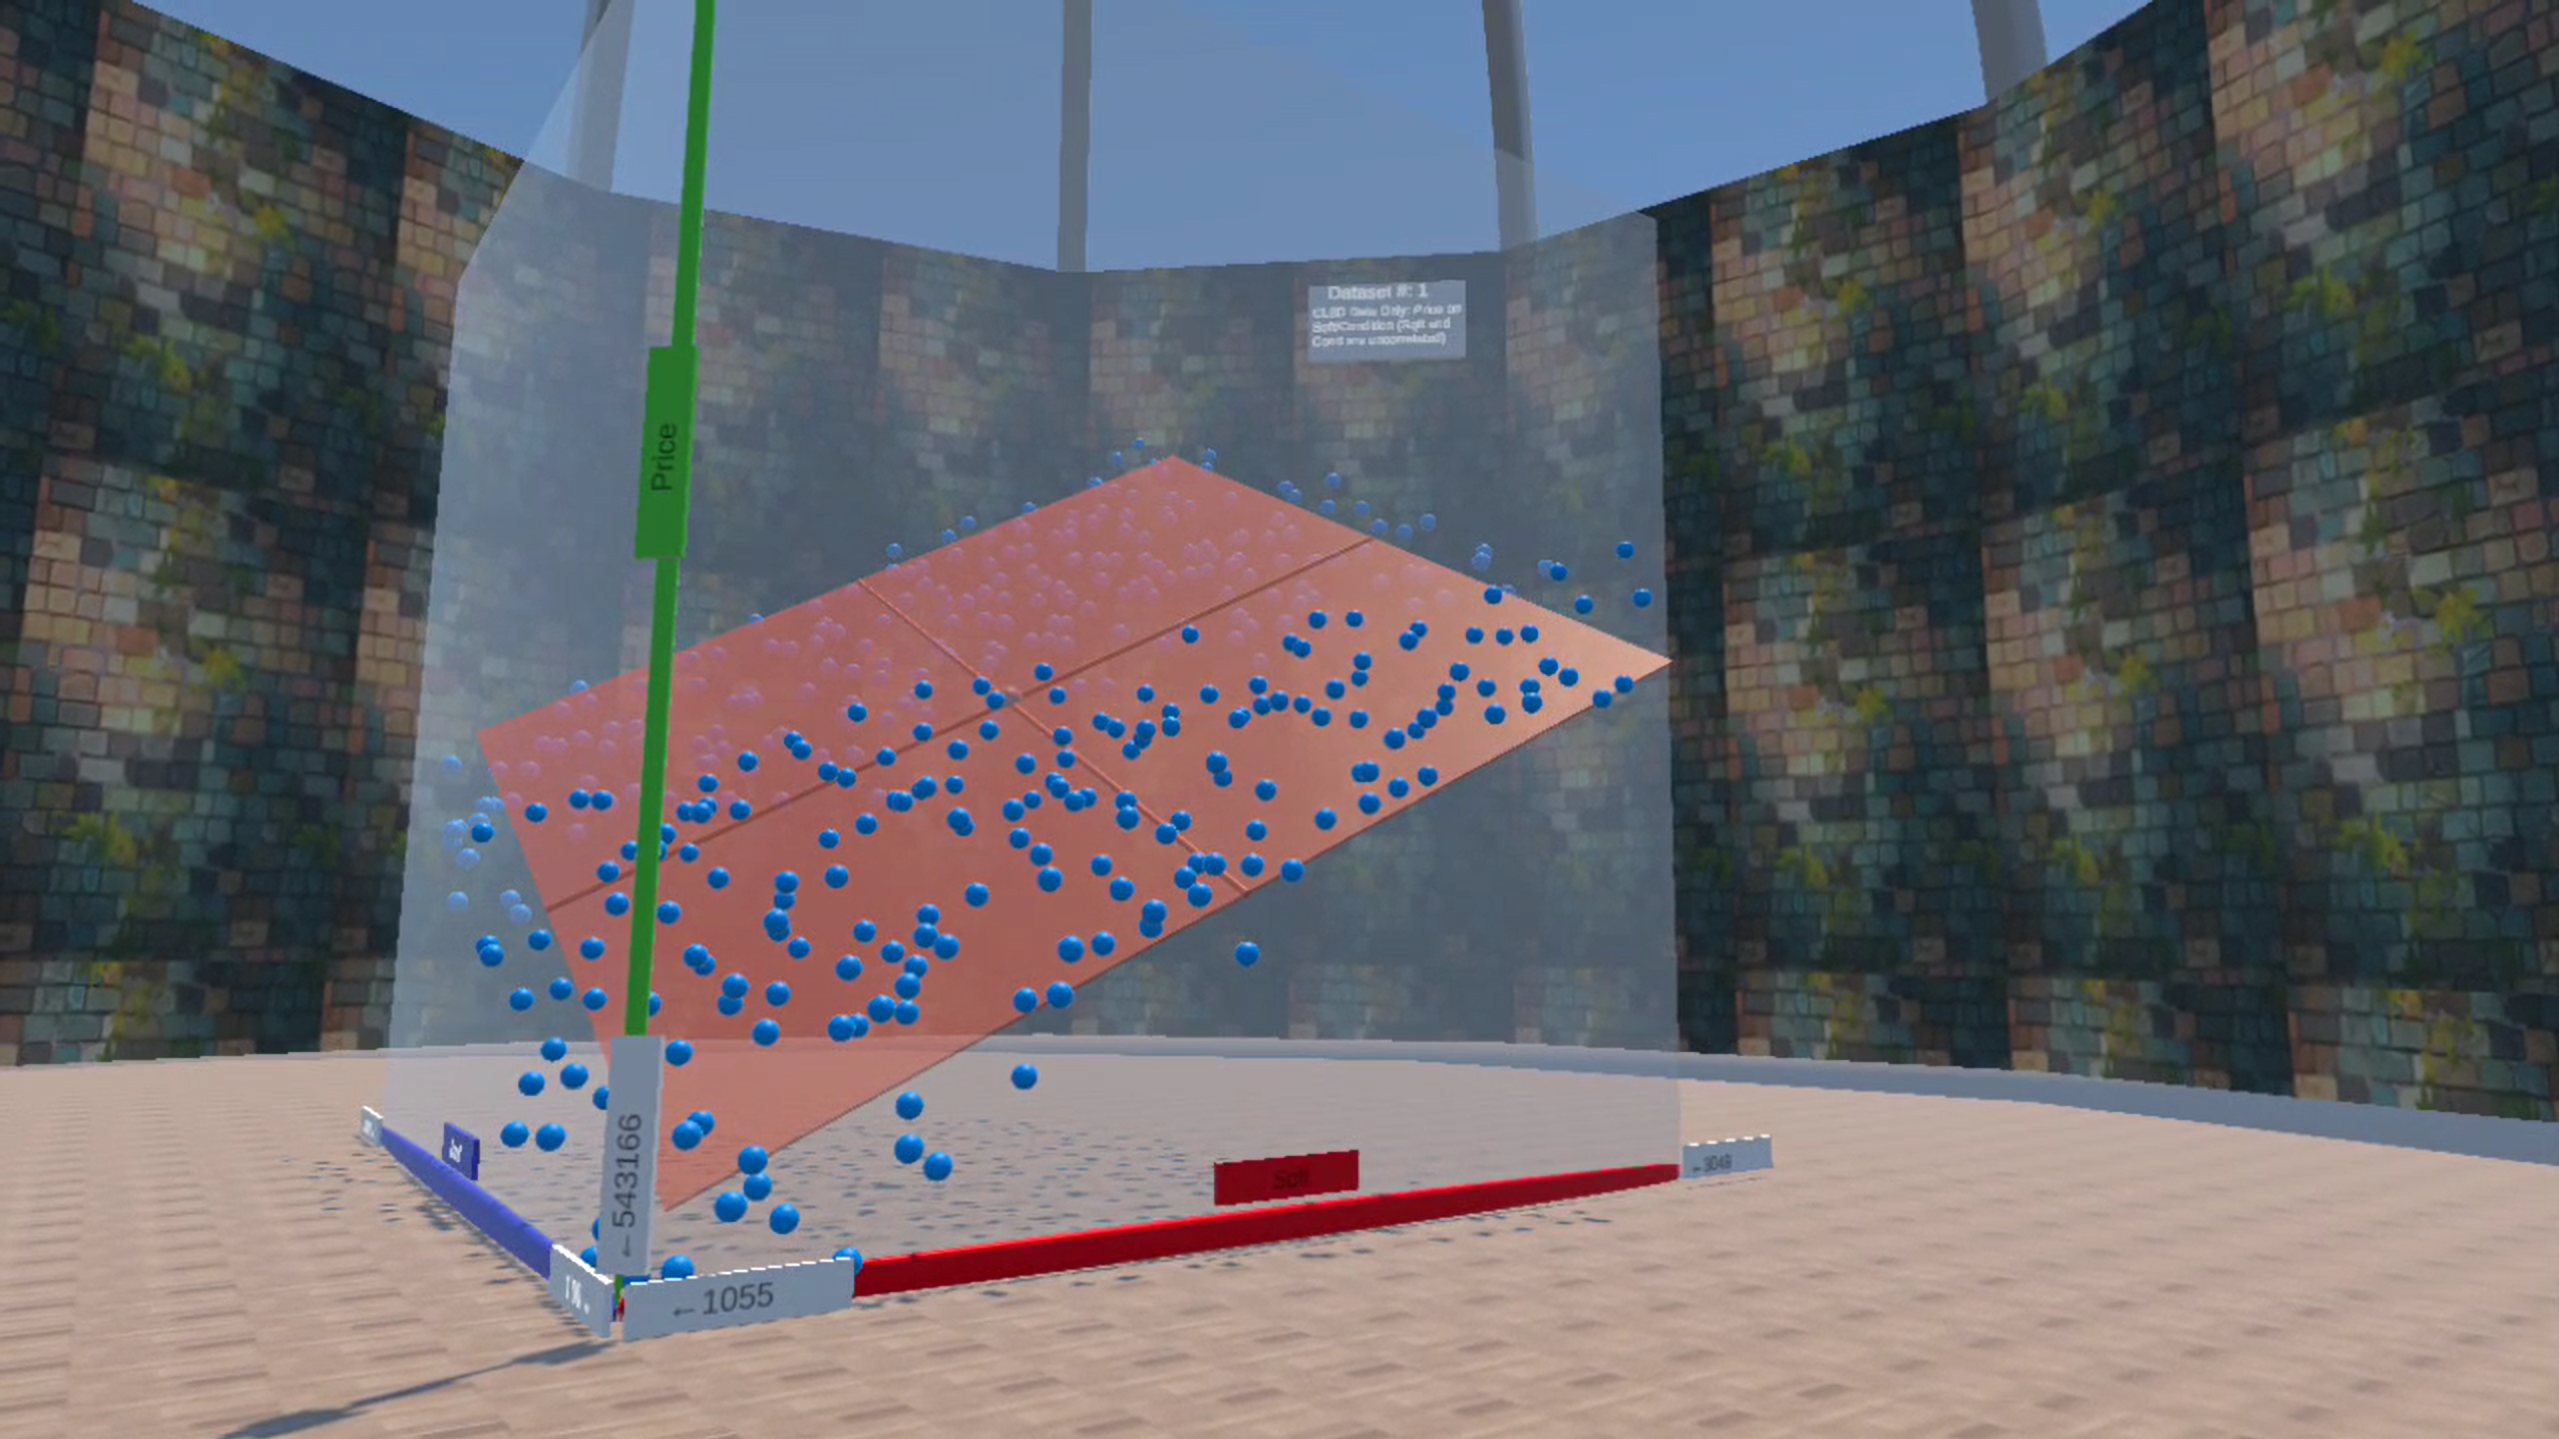
In a museum-like environment, instructors, self-learners, and students interact with datasets within a walkable, life-scale 3D visualization. For example, users can adjust a regression plane to the data points and the corresponding regression equation updates automatically in real time.
For self-learners, an exhibition guide avatar leads students through the datasets featured in each exhibition.
In classroom (instructor–student) mode, instructors provide contextual explanations. When an instructor selects a new dataset using their controller, the dataset automatically updates for all students in real time.
Thematic Data Exhibitions
Currently the app features several thematic data exhibitions that can be accessed by entering a code at the entrance of the exhibition building:
Linear Regression with Two Independent Variables
This exhibition shows data points and a regression plane for a regression with two independent variables, where no multi-collinearity is present. Students can be combine two simple regressions into a multi-variate regression by step-wise adjusting the regression plane (the regression equations).
Self-Learner Code: 590001
For Classroom (Instructor/Student) Codes: click here
Simple Regression
This exhibition is a preparation for the exhibition above aimed at beginning level students. It explains the very basics of a simple regression between house price and square footage. Students can adjust a regression line together with the related equation.
Self-Learner Code: 590009
For Classroom (Instructor/Student) Codes: click here
Random Forest Regression
This exhibition shows how a Random Forest model can be used to predict housing prices. It covers the splitting of the dataset in training and testing data, shows the resulting non-linear prediction surface, and the prediction assessment with the testing data.
Self-Learner Code: 590003
For Classroom (Instructor/Student) Codes: click here
More Thematic Data Exhibitions are currently prepared (e.g., Multivariate Regression with Multicollinearity, Degree of Freedom Visualized, Principal Component Analysis Visualized). Instructors, who plan to contribute their own Thematic Data Exhibition, please contact clange@cpp.edu
Using the VR App with a Meta Quest Headset
The Diagram Exhibition app is a standalone app that gives instructors flexibility and does not rely on any external cloud service.
The app runs locally on each student’s (and the instructor’s) Meta Quest headset.
If used in the classroom or in online teaching a Internet connection with low bandwidth is sufficient to allow the instructor to advance the the data displayed in the diagram. Communication between instructor in a classroom setting is traditional and live not through the headset. If used for online teaching a Zoom or similar application is needed for instructor/student communication.
To install the app on a Meta Quest headset, the headset has to be in Developer Mode, which allows installing apps that are not from the Meta Store
The app is available for free via the SideQuest platform:
Get Diagram Exhibition App
Instructions on how to set your headset to Developer Mode and how to load the a SideQuest app are below:
How to Side Load
Teaching Strategy
The instructor should familiarize the students with how to use the Meta Quest controllers. Especially, how they can move in the Virtual Reality, how they can pickup objects, and how they can push a button using the controller. A related video is provided in the staging area of the Diagram Exhibition.
Students should be asked if they have health conditions that prevent them from using VR headsets and should be advised to stop using the headset in case they feel uncomfortable.
Communication:
For self-learners, an exhibition guide avatar communicates directly with the student. In a classroom setting, instructors communicate with students using their natural voice. In online settings, standard conferencing tools such as Zoom can be used for instructor–student communication.
Accessibility:
To ensure that the instructional benefits of the app are also available to students who cannot use a VR headset, instructors can broadcast their VR view to any display connected to the same Wi-Fi network as the Meta Quest headset (via Quick Settings on the instructor’s headset).
Exhibition Codes
When entering the Diagram Exhibition building a code that is entered at the entrance door determines which Data Exhibition is displayed. For each Data Exhibition two types of codes exist:
Self-Learner Code (odd): When this code is entered, the self-learner is guided through the exhibition by an Exhibition Guide Avatar.
Classroom (even):
The classroom code is used when an instructor guides students through the exhibition. The instructor and students enter the exhibition independently, but they will always view the same datasets. When the instructor advances to the next dataset, the students’ datasets advance simultaneously. This allows the instructor to guide students through the datasets successively. Note: the upper button on the instructor’s right controller advances the datasets; the lower button rewinds.
To distinguish between instructor and student codes, an instructor code is preceded by a two-digit instructor key. For example, 590002 is a student code, while 21590002 is the corresponding instructor code.
Currently Available Data Exhibitions with Codes
Linear Regression with Two Independent Variables
This exhibition shows data points and a regression plane for a regression with two independent variables, where no multi-collinearity is present. Students can combine two simple regressions into a multi-variate regression by step-wise adjusting the regression plane (the regression equations).
Self-Learner Code: 590001
For Classroom (Student: 590002 & Instructor: 21590002)
Simple Regression
This exhibition is a preparation for the exhibition above aimed at beginning level students. It explains the very basics of a simple regression between house price and square footage. Students can adjust a regression line together with the related equation.
Self-Learner Code: 590009
For Classroom (Student: 590010 & Instructor: 21590010)
Random Forest Regression
This exhibition shows how a Random Forest model can be used to predict housing prices. It covers the splitting of the dataset in training and testing data, shows the resulting non-linear prediction surface, and the prediction assessment with the testing data.
Self-Learner Code: 590003
For Classroom (Student: 590004 & Instructor: 21590004)
Instructors, who like to work with their own codes or plan to contribute their own Thematic Data Exhibition, please contact clange@cpp.edu